

406.587.4531
simmental@simmgene.com
406.587.4531
simmental@simmgene.com
Building the Next $API and $TI: A Look at the Updated Model
by Dr. Jon DeClerck, ASA EVP
A few weeks ago, I wrote about why it is time to update $API and $TI. The short version is that three things have changed: the economics of the cattle business, the technology available to model profitability, and the traits we can now measure and predict directly.
Before digging deeper into what has changed within the indexes, it is probably worth taking one step back and asking a more basic question:
What exactly are $API and $TI trying to do?
At their core, economic indexes combine multiple EPD into one number designed to predict profit within a specific production system. I think of it like a scoreboard. If I gave you all the statistics from a baseball game: hits, errors, strikeouts, walks, home runs, you would have a lot of useful information, but you still might not know who won.
EPD are those individual statistics. $API and $TI are the final score. The score does not replace the stats; it simply helps show how they add up economically. Once you know the score, you can go back to the individual EPDs and see how an animal got there. One bull may generate profit through Stayability, while another may get there through growth and carcass merit.
How does the updated simulation work?
The word simulation can also make this process sound more complicated than it really is.
Every breeder simulates or estimates profitability when evaluating cattle. You study a bull, his phenotype, pedigree, and EPD, and decide what you believe he could be worth in your program. The computer model is doing a similar exercise, using the animal’s genetics and the economics of the production system to estimate profit.
To build the updated indexes, ASA customized the iGENDEC software to better reflect the production systems our breeders and commercial customers operate in. Both $API and $TI begin with a 500-head herd of 1,300-pound Angus cows, but from there the two indexes take different paths.
$API assumes the producer keeps replacement females, so cow size can change over time. It also uses a fixed land base, in simple terms, the ranch only has so much grass. If the cows get bigger, you can run fewer of them; if they get smaller, you can run more. That gives the model a practical way to balance cow maintenance costs against the downstream carcass value of the calves they produce.
$TI starts with the same cow herd, but it is a terminal index. No replacements are kept, so cow size stays constant and the focus stays on the value of the terminal calf through the feedlot and on the rail.
Another major improvement is breed composition. Instead of one set of assumptions for every animal, the updated indexes evaluate Simmental percentage in 10% increments. That helps the model better account for heterosis and breed complementarity.
The figures below show how relative trait emphasis differs between half-blood and purebred Simmental cattle in $API and $TI.
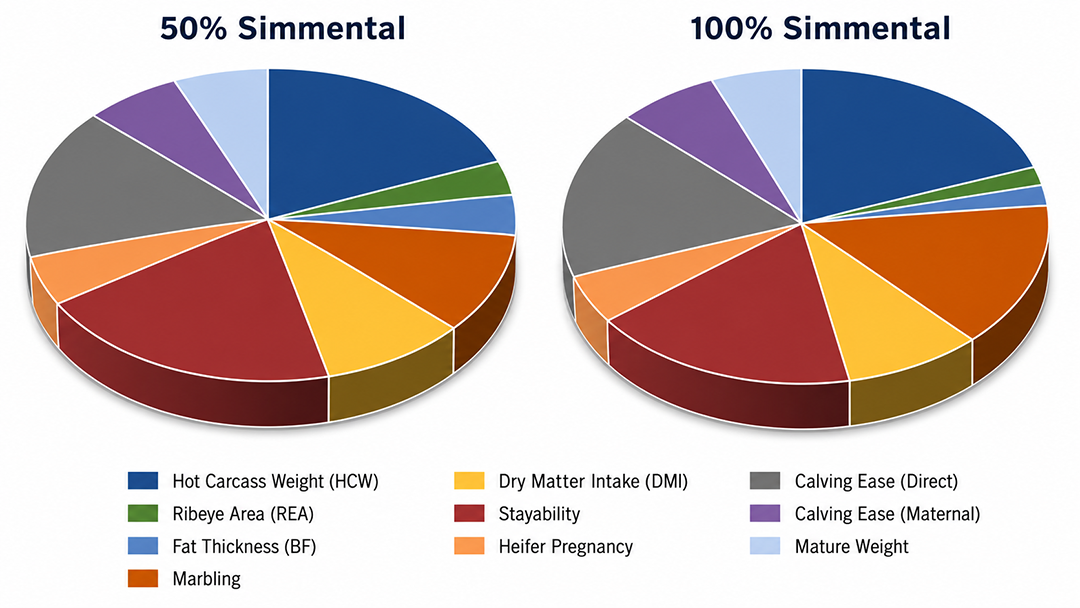
Figure 1. Relative trait emphasis in updated $API for 50% and 100% Simmental cattle.
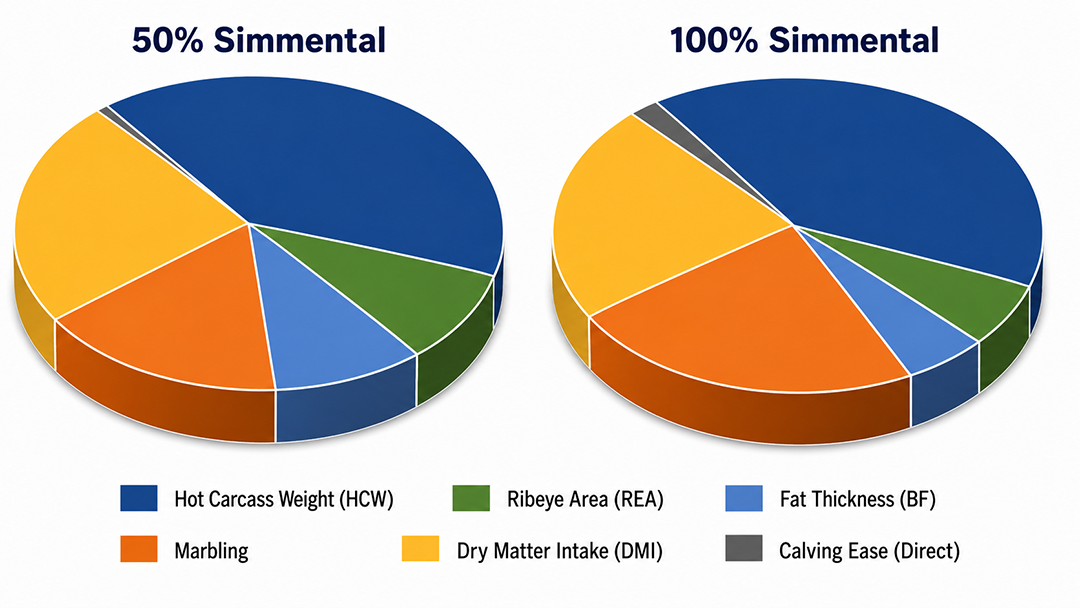
Figure 2. Relative trait emphasis in updated $TI for 50% and 100% Simmental cattle.
In simple terms, the model recognizes that a half-blood Simmental bull and a purebred Simmental bull are likely to bring different strengths when mated to purebred Angus cows.
As a former beef cattle nutritionist, I think about it like ration formulation. Imagine feeding the same ration to weaned calves, developing sale bulls, and mature cows. It might work reasonably well, but it would never be as precise as formulating a ration for each class of cattle.
The original $API and $TI worked in much the same way, using one general relative-emphasis framework (the familiar $API pyramid). The updated model allows emphasis to change as breed composition changes, much like adjusting a ration to better fit the cattle you are feeding.
There will be much more to discuss in the weeks ahead, including why certain traits receive more or less emphasis and how today’s economics influence those decisions.
We are excited about where the updated $API and $TI are headed and will continue sharing more detail as we move forward.
Subscribe to our weekly eNews, Eblasts, Sales Call
Subscribe to eNews ASA's weekly newsletter.
Sales Call: Calendar of upcoming sales and
eBlast: Sales and other industry promotions